Soil carbon monitoring and trends
Understanding the important factors driving the changes in soil organic carbon (SOC) concentration will identify where the opportunity for improved SOC storage in the South Australian agricultural zone is by soil texture, land use and agricultural district.
DEW has been in partnership with PIRSA to assess the influence of soil type, rainfall and farming system on the amount and nature of soil organic carbon. A recent study established SOC concentration benchmarks and baselines for the South Australian agricultural zone based on soil test data for the period 1990-2007. The meta-analysis included approximately 36,000 soil test results collated over that period. SOC levels and the proportion of soil samples analysed within low, medium and high SOC ranges for soil texture, land use and agricultural districts were defined.
The key findings include:
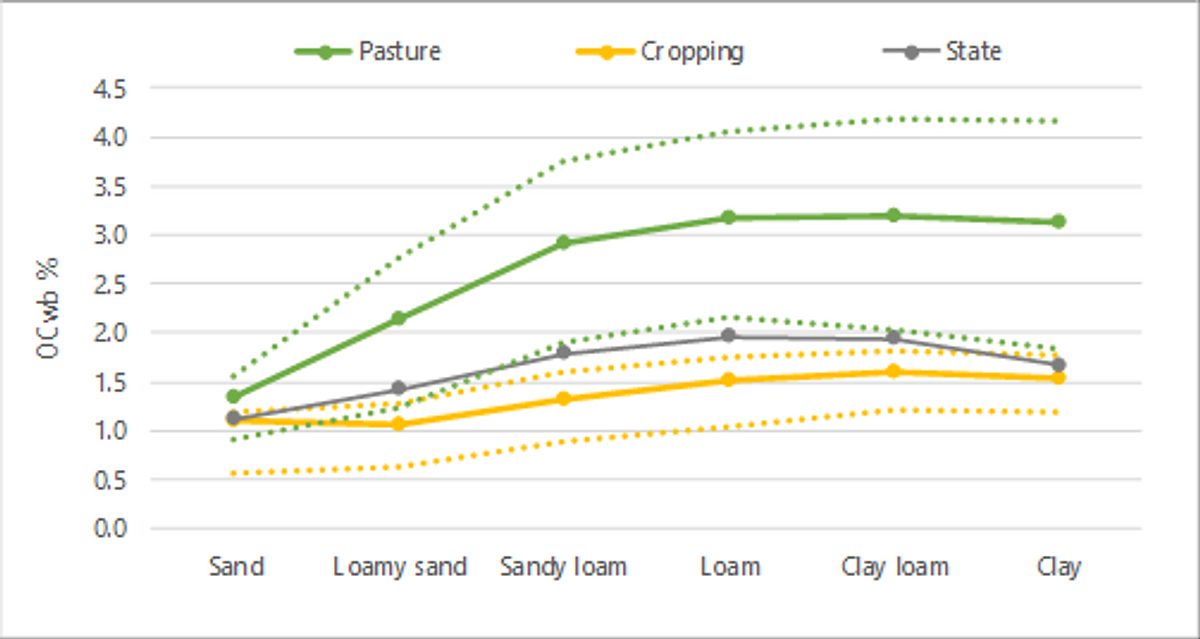
- As expected, SOC values increased with increasing clay concentration for sand to loam textured soil. However, there was a plateau for clay loam and an unexpected decline in SOC for clay-textured soils. This could indicate potential for improved soil carbon storage if limitations could be overcome and requires further investigation.
- There is opportunity to increase SOC below the topsoil layer under a conducive environment. The subsurface soil held approximately 75% and the subsoil 30% of the topsoil SOC concentration.
- Pasture soils had higher mean and a wider range of SOC concentration by soil texture than cropping soils.
- SOC concentration increased on average by 0.08% per annum (p.a.) during 1990 to 2007. This was largely driven by an increase in SOC of 0.11% p.a. in pasture soils with a smaller but still positive increase of 0.04% p.a in cropping soils.

Soil Organic Carbon Benchmarks by Rainfall and Soil Texture
Benchmarks were determined for common topsoil textures by annual rainfall, and serve as guidelines only to help farmers and advisors assess if topsoils have the capacity to build additional soil organic carbon. The guides are based on the analysis and interpretation of over 35,000 soil samples measured by the Walkley Black laboratory method.
Soil Organic Carbon Benchmarks by Rainfall and Texture
Soil Organic Carbon Benchmarks for SA Agricultural Districts
Benchmarks were determined for individual agricultural districts based on PIRSA Crop and Pasture Report districts which correspond to Local Government jurisdictions. A summary of SOC benchmarks measured by the Walkley-Black laboratory method for the 0-10 cm depth are presented for soil texture, key land uses and annual changes in SOC. Explore SOC benchmarks for your district below:
Lower Eyre Peninsula |
Information is based on the districts defined in the following map:

(source Crop and pasture reports - PIRSA)


